|
Click to listen to this article
|
By Michael A. Metiva and Zachary D. Hayden, Michigan State University
On the irrigated, sandy soils of west Michigan, nitrogen (N) management strategies for processing carrots must balance potential losses in yield and quality against the risks of N loss to the environment and high root nitrates at harvest. As a result, many growers utilize multiple topdress N applications throughout the season to “spoon-feed” N to their crops. Labor-intensive petiole sap nitrate sampling is often used to assess when and how much topdress N is needed in a particular field and year.
While petiole sap nitrate testing using handheld meters has the advantages of relatively straightforward sampling and rapid readings to assess plant N, it also suffers from high labor requirements to collect and process the petiole samples, small sample size in the field, high data variability and uncertainty about the accuracy of published thresholds for triggering N applications across different carrot varieties and soils.
As part of a larger experiment in 2019 and 2020 investigating optimal N fertilizer management in processing carrots, we evaluated the pros and cons of newer drone technology as an alternative to petiole nitrate testing for managing topdress decision making.
Experiment Details
In April of both study years, carrots (cultivar Cupar) were planted in sandy, irrigated commercial production fields with 26 lb/ac of starter N; carrots were subsequently harvested in October. Treatments included four season-total N fertilizer rates (26 [starter only], 60, 120 and 180 lb/ac N) in conjunction with two topdressing strategies (single frontloaded topdress in July vs. three split applications in July, August and September). Additional treatments looked at the timing of split applications for the recommended 120 lb/ac N rate, moving split applications either two weeks earlier or later.
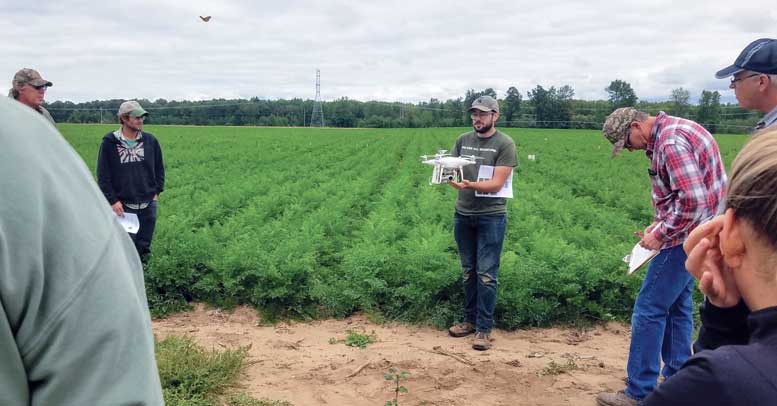
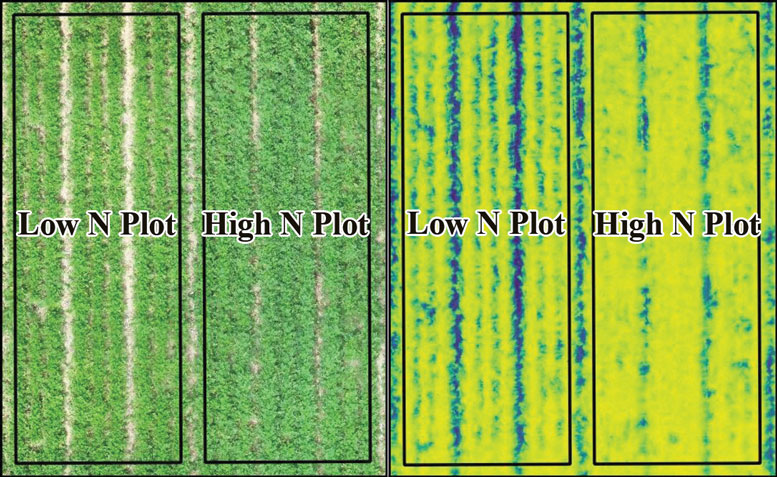
Every two weeks starting in early June, we sampled petioles from each experimental plot and tested sap nitrate levels. We also flew a small quadcopter carrying both a standard RGB digital camera and an additional, more expensive multispectral camera (Micasense RedEdge MX). Drone imagery was then used to calculate vegetation indices (VIs) related to plant N status for each plot (Fig. 1).
Topdress N treatments created variability in the N status and yield of carrots over time, allowing us to try to detect differences using both petiole sap nitrate testing and drone imagery.
Drones vs. Petiole Nitrate Testing: Correlations with Yield
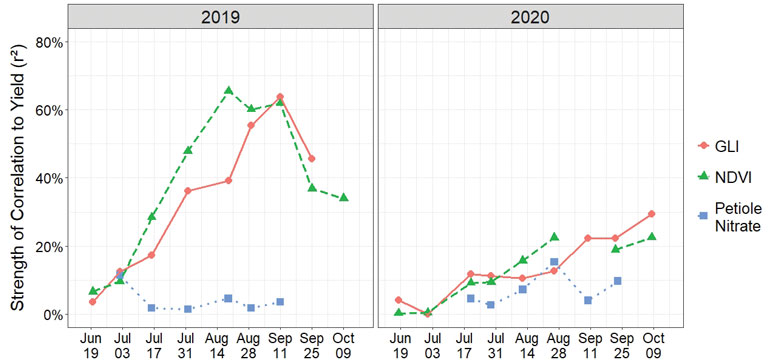
If a measurement of N status is finding meaningful differences, those differences should be reflected in final yield. Fig. 2 shows that drone-based vegetation indices from either the drone’s normal digital camera (Green Leaf Index [GLI]) or the added multispectral camera (Normalized Difference Vegetation Index [NDVI]) were both more strongly correlated with yield than petiole sap nitrate testing. This was especially true from mid-August to mid-September in 2019 when the strength of the correlations exceeded 50 percent, meaning over half of the variation in yield could be explained by information the vegetation indices were picking up.
Along with fewer yield differences overall, correlations were lower in 2020, where no N status metrics explained more than 20 to 30 percent of the yield variation on any date. Still, drone indices did as well as or better than petiole nitrate.
Guiding Topdress Application Decisions
The idea behind both petiole sap nitrate testing and drone-based vegetation indices is to apply N when the crop’s N status (as measured by these tools) drops below a certain threshold. For petiole sap nitrate, different thresholds have been published from university research, though concerns remain that these values may be specific to a given variety or region.
Drone-based decision making relies on a different “sufficiency index” approach, which requires comparing vegetation index values to a high-N reference area within the field that represents adequate N fertilization. Normalizing VI values using this in-field reference transforms the vegetation indices into “sufficiency indices” (SIs) which measure how close other areas look to the high-N reference. Making topdress decisions requires both establishing appropriate reference areas and deciding on a threshold relative to the reference below which topdresses should be applied.
Using SIs has the advantage of capturing N status differences independent of variations due to variety, disease, growth stage or other factors accounted for by comparison with the reference area. However, more research is needed to evaluate the optimal reference treatments and threshold values to use in carrots.
In this trial, an analysis using our high-N, frontloaded topdress treatment as the reference area and a threshold value of approximately 1 (apply a topdress if a given area looks “worse” than the reference) found that drone-based SIs recommended topdress applications about 25 to 35 percent less often, on average, than petiole nitrate testing, with the potential to reduce N costs and pollution from wasted N.
Practical Considerations
Drone-based SIs show promise relative to petiole nitrate testing for topdress decision support. In particular, drones may offer greater accuracy, larger sampling areas, fewer labor hours, and more interpretable, frequent and multi-purpose information on crop status. The accessibility of these advantages may well increase over time through improvements in drone or satellite technology and greater speed and availability of image processing services.
However, maintaining appropriate high-N reference areas adds additional management complexity, and the additional time and expertise required to fly the drone and process the imagery likely necessitates use of a service provider for all but the most tech-savvy growers. Upfront costs for a drone and software are also generally higher than for a handheld nitrate meter (in our case, approximately $1,500 for the drone and $2,000 for the software versus $400 for a nitrate meter). The addition of the multispectral camera to the drone cost nearly $6,000 more, but our similar results for both cameras suggest this extra cost may be unnecessary.
More research is needed to test drone-based adaptive N management for carrots at field scale and identify tradeoffs as the farming technology landscape continues to evolve. Still, our research shows promise for using drones in carrot nitrogen management.